Chi-Square Analysis: The Pokemon GO Survey.

My last math assignment was to conduct a survey on a certain topic and population sample. I chose the topic to be Pokemon GO, and the sample to be 2 of the classrooms at my school. After I collected the results, I had to present them to my teacher, along with high-level analysis on the results. For many questions, I had to check whether there was a correlation between 2 facts. For that, I discovered a mathematical way to do it: chi-square analysis.
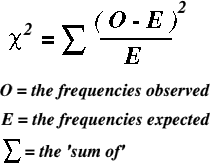
Chi-square analysis is used to check if there is a correlation between the results of a survey. Here is the formula for it:
Let me show you an example directly from the survey I conducted.
One of the things I wanted to find out was how much players liked Pokemon GO, to their level in Pokemon GO. This is the table I used:
| 0 | 10 | 20 | 30 | 40 | Grand Total | |
| 5 | 2 | 1 | 3 | |||
| 6 | 1 | 2 | 3 | |||
| 7 | 1 | 1 | 2 | |||
| 8 | 1 | 1 | ||||
| 9 | 2 | 2 | 1 | 1 | 6 | |
| 10 | 1 | 1 | 2 | 4 | ||
| Grand Total | 1 | 7 | 8 | 1 | 2 | 19 |
Each row is the level range(10 is 10-19, 20 is 20-29), and each column is how much they like Pokemon GO.
You must now find the expected value for each cell of the table. To do so, simply multiply the column total with the row total, then dividing it by the grand total. Do this for each cell. Now that you have your expected values, do the formula for each cell, and since there is a sigma, add all of it up. Then, you should get your chi-square. What you need now is your P-value. I haven’t figured out how to calculate the P-value, so just enter your chi-square and degrees of freedom into a P-value calculator. You also need to know what the degrees of freedom are for the table. To find out, do this equation: (rowTotal – 1) * (columnTotal – 1).
I made a Google Slides presentation on the survey results. It is right below this text if you would like to see it.
For a handy chi-square calculator, click this link
